
Fractal geometry plays two roles. It is the geometry of deterministic
chaos and it can also describe the geometry of mountains, clouds and
galaxies
Benoit Mandelbrot
Science and geometry have always progressed hand in hand. In
the 17th century, Johannes Kepler
found that he could represent the orbits of the
planets around the Sun by ellipses. This stimulated
Isaac Newton to explain these elliptical orbits
as following from the law of gravity. Similarly, the back-and-forth motion
of a perfect pendulum is represented by a sine wave. Simple dynamics used
to be associated with simple geometrical shapes. This kind of mathematical
picture implies a smooth relationship between an object's form and the forces
acting on it. In the examples of the planets and the pendulum, it also implies
that the physics is deterministic, meaning that you can predict the future
of these systems from their past.
Two recent developments have deeply affected the relationship between geometry
and physics, however. The first comes from the recognition that nature is
full of something called deterministic chaos. There are many apparently
simple physical systems in the Universe that obey deterministic laws but
nevertheless behave unpredictably. A pendulum acting under two forces,
for example. The notion of deterministic yet unpredictable motion is a
surprise to most people.
The second development came from efforts to find mathematical descriptions
for some of the most irregular and complicated phenomena we see around us:
the shapes of mountains and clouds, how galaxies are distributed in the Universe,
and nearer home, the way prices in the financial
markets fluctuate. One way of obtaining such a description is to seek
a "model". In other words, I had to invent or identify mathematical rules
that can produce "mechanical forgeries" of some part of the reality- a photograph
of a mountain or a cloud, a map of deepest space,or a chart on the financial
pages of a newspaper. Indeed, Galileo proclaimed that "the great book of
nature is written in mathematical language", adding that "its characters
are triangles, circles and other geometrical figures, without which one wanders
in vain through a dark labyrinth". Such Euclidean shapes have, however, proved
to be quite useless in modelling either deterministic chaos, or irregular
systems. These phenomena need geometries that are very far from triangles
and circles. They require non-Euclidean
structures in particular, a new geometry called
fractal geometry.
|
 |
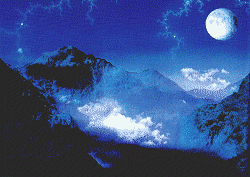
| Fractal modelling on a computer produces extraordinary landscapes such as these mountain scenes | |
I coined the word fractal in 1975 from the latin fractus
which describes a broken stone-broken up and irregular. Fractals are
geometrical shapes that, contrary to those of
Euclid, are not regular at all. First, they
are irregular all over. Secondly, they have the same degree of irregularity
on all scales. A fractal object looks the same when examined from far away
or nearby-it is self-similar. As you approach it, however, you find that
small pieces of the whole, which seemed from a distance to be formless blobs,
become well- defined objects whose shape is roughly that of the previously
examined whole.
Nature provides many examples of fractals, for example, ferns, cauliflowers
and broccoli, and many other plants, because each branch and twig are very
like the whole. The rules governing growth ensure that small-scale features
become translated into large-scale ones.
| The Sierpinski gasket- a simple fractal produced by breaking up a triangle into successively smaller ones |
A striking mathematical model of the way fractals work is the Sierpinski
gasket. Take a black triangle and divide it into four smaller triangles,
as shown opposite, and erase the central fourth triangle so that it leaves
a white triangle. Each new black triangle will have sides that are half as
long as the initial triangle. Repeat the exercise with each new triangle
and you obtain the same structure on an ever decreasing scale with a detail
that is twice as fine as that in the preceding stage. When parts of the object
are exactly like the whole, the object is said to be linearly self-similar.
However, the most important fractals deviate from linear
self-similarity. Some of these are fractals that describe general randomness,
while others are fractals that can describe chaotic, or nonlinear, systems
(where the factors affecting the way the system behaves are not proportional
to the effects they produce). Let us take one example of each.
Random fractals became best known through the stream of forgeries of coastlines,
mountains and clouds, such as the one on the opposite page, which my colleagues
and I have been producing since 1975 using computer graphics. Other examples
are some of the scenes made for films such as Star Trek II.
Our work on such fractal modelling began with a bit of folk wisdom and a
lot of natural history. The folk wisdom started with observing something
that even a cubist painter knows. "Clouds are not spheres, mountains are
not cones, coastlines are not circles, and bark is not smooth, nor does lightning
travel in a straight line." All these natural structures have irregular
shapes that are self-similar. In other words, we discovered that successively
magnifying a part of the whole reveals a further structure that is nearly
a copy of the original we started with.
The natural history involved collecting and classifying facts about natural
structures. For example, as you measure the coast of a country with ever
increasing precision, its length becomes greater because you have to take
into account ever smaller irregularities along the length. Lewis Fry Richardson
has found an empirical law that describes this increase.
To make sense of fractal geometry we have to find ways of expressing the
shape and complexity in terms of numbers, just as Euclidean geometry uses
the notions of angle, length, area or curvature, and the notions of one,
two or three dimensions.
For complicated geometrical objects, the ordinary notion of dimension may
vary with scale. As an example, take a ball with a diameter of 10 centimetres
made of a thread of 1 millimetre. From far away, the ball appears as a point.
From a distance of 10 centimetres, the ball of thread is three- dimensional.
At 10 millimetres, it is a mess of one- dimensional threads. At 0.1 millimetres,
each thread becomes a column and the whole becomes a three- dimensional object
again. At 0.1 millimetres, each column dissolves into fibres, and the ball
again becomes one- dimensional, and so on, with the dimension "crossing over"
repeatedly from one value to another. When the ball is represented by a finite
number of atom-like pinpoints; it becomes zero- dimensional again.
 |
| Cauliflowers and ferns are examples of natural fractals |
For fractals, the counterparts of the familiar dimensions (0, 1,2,3) are
known as fractal dimensions. Usually, their values are not whole numbers.
The simplest variant of fractal dimension is the similarity dimension
Ds. Applied to a point, a line, a square or a cube,
Ds simply gives the number of ordinary dimensions needed
to describe the object -0,1,2,3 respectively. What about a curve that is
a linearly self-similar fractal? Such a curve can range from being an almost
smooth, one-dimensional line to being nearly plane filling, which means that
the line twists and turns so much that it visits nearly every part of some
region of the plane, becoming almost two-dimensional. Correspondingly the
value of Ds, will range up from just above 1 to just below
2. Thus, Ds can be said to measure the complexity of this
curve. More generally, Ds measures the complexity or degree
of roughness of a fractal shape.
Another simple fractal dimension is the mass dimension. The mass in a
one-dimensional straight rod increases in proportion to its length, say,
2R. The mass in a two- dimensional disc of radius R increases
in proportion to pR2, the area
of a circle. And the mass in a ball increases in proportion to
4/3pR3, the volume of a sphere.
So when a further dimension is added, the mass grows in proportion to
R raised to a power indicating the number of dimensions. In the case
of a fractal, the mass grows proportionately to R raised to some power
Dm that is not a whole number. That is, Dm
plays one of the usual roles of dimension, so it is natural to call it
a fractal dimension. It is fortunate that in all the simple cases,
Ds, and Dm (and other definitions of
fractal dimension) take precisely the same value. In cases beyond the simplest
they may differ.
1: Order and chaos in the Mandelbrot and Julia sets |
||||
| Take a starting point C0 in the plane
of coordinates u0 and v0. From the coordinate
of C0 , form a second point C1 of coordinates
u1=u02 -
v02 + u0 and
v1 = 2u0v0 +
v0. Next, form the point C2 of coordinates
u2 = u12 -
v12 + u0 and
v2 = 2u1v1 +
v0. More generally, the coordinates uk and
vk of Ck are obtained from
uk - 1 and vk - 1 by the
so-called iterative formulas uk =
u2k - 1-
v2k - 1+ u0 and
vk = 2uk -
1vk - 1 + v0.
|
The next step in modelling is to imagine the simplest geometrical
construction that might have the right properties to generate the structure.
In fact, I have put together, and constantly enrich, a toolbox of such
constructions that are useful for fractal geometry. To test which mathematical
tool would be appropriate, we compare the numerical characteristics of the
model with the real thing-the fractal dimensions of a mountain, for example.
This is not enough, however. We also use computer graphics to test how good
a tool we have.
At the end of the day, we hope to produce a theory from the fractal modelling
of mountains that can describe the relief of the Earth.
Because fractals have proved useful in describing complex natural shapes,
it is not surprising that fractals also play a part in describing how complex
dynamical systems behave. As previous articles in the chaos series have shown,
the equations that model turbulence in liquids, the weather, or the dynamics
of insect populations are nonlinear and show behaviour typical of deterministic
chaos. If we iterate these equations - examine their solutions as they evolve
over time - we find that many of the mathematical properties, especially
when shown as computer graphics, reveal themselves to be self-similar. Examples
are the "phase portraits" of so called
strange attractors described last
year in Ian Stewart's article (New Scientist,
"Portraits of chaos", 4 November 1989).
My best-known contribution to this area of nonlinear fractals is called the
Mandelbrot set (see Box 1). The set results
from iterating a relatively simple equation. It produces the most extraordinary
graphics, rich in complexity. Some people have called it the icon for nonlinear
fractal geometry.
The Mandelbrot set does not just produce beautiful pictures. If we examine
many pictures with great care, we find innumerable empirical observations
that can be restated in the form of mathematical conjectures. Many of these
have already led to brilliant theorems and proofs. It has also inspired a
new approach to mathematics, using a computer screen.
 |
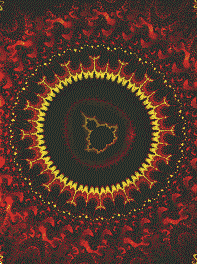
| The heart of the Mandelbrot set seen here is the result of blowing up the set by Avogadro's number (x 1023). It remains forever intricate on any scale |
Mathematical conjectures usually originate in previously known
theorems. In recent decades, there was no input at all from physics or from
graphics, which meant that some areas of pure mathematics, such as the theory
of iteration, (to which the Mandelbrot set belongs) ran out of steam. Fractal
pictures done on the computer have revived it. Being able to play with pictures
interactively has provided a deep well for mathematical discoveries. Examining
the Mandelbrot set has led to many conjectures that were simple to state
but hard to prove. Studying them has produced a host of interesting side
results.
Of course, many related fractals lead to beautiful and intriguing graphics.
Indeed, several shapes known today as fractals were discovered many years
ago. Some of these mathematical entities appear in the work of the French
group of mathematicians, Henri
Poincaré, Pierre Fatou and
Gaston Julia, at various times from 1875
to 1925. But nobody realised their significance as visual descriptive tools
and their relevance to the physics of the real world.
One model where random fractals describe the real world is a form of random
growth called diffusion limited aggregation, or DLA (see below). This yields
tree-like shapes of baffling complexity. DLA can be used to model how ash
forms, how water seeps through rock,how cracks spread in a solid and how
the lightning discharges.
To see how it works, take a very large chess board and put a queen, which
is not allowed to move, in the central square. Pawns, which are allowed to
move in either of the four directions on the board, are released from a random
starting point at the edge of the board, and are instructed to perform a
random, or drunkard's walk. The direction of each step is chosen from four
equal probabilities. When a pawn reaches a square next to that of the original
queen, it transforms itself into a new queen and cannot move any further.
Eventually, a branched, rather spidery-looking collection of queens, called
a "Witten Sander DLA cluster", grows.
Quite unexpectedly, massive computer simulations have shown that DLA clusters
are fractal; they are nearly self- similar. Small portions are very much
like reduced versions of large portions. But clusters deviate from randomised
linear self-similarity, something that will pose interesting challenges for
the future.
What is special about this kind of fractal growth is that it shows very clearly
how parameters that vary smoothly produce rugged behaviour. To show how,
let us rephrase the original construction in terms of the theory of electrostatic
potential. Imagine a big box, in which the DLA is constructed, is set to
a positive electrical potential, and the target object, the original queen,is
put at the centre and set to a potential of zero. What is the value of the
potential elsewhere in the box?
 |
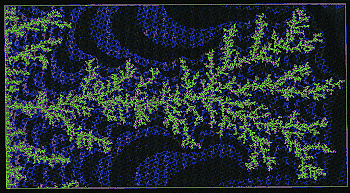
| A random fractal called a diffusion limited aggregate produces fern-like shapes that model lightning and other natural phenomena |
In the cases where the outline of the central object is a
smooth curve, or has small number of kinks, like a triangle or a square,
scientists have long known how to compute the potential. These classical
analytical calculations determine the curves along which the potential is
the same. All these curves are smooth, and they provide progressive transitions
between the fixed box and the boundary of the fixed object at the centre.
Next, suppose that the boundary includes a needle-like projection. Around
the needle, the equipotential curves would be very crowded. The drop in potential
would be very steep, causing an electrical discharge: the needle would act
like a lightning rod. When the centre object is a DLA cluster, all its boundary
is lined with needles, and lightning will fall most often on those needles
that are the most exposed.
Here comes a critical novelty: the mechanism of DLA is equivalent to postulating
that, after a needle has been struck by lightning, it extends or branches.
The experiments on DLA teach us when we allow boundaries to move in response
to the potential, the cluster grows into an increasingly large DLA structure.
This implies we can create rough fractals from the smoothness characteristic
of the equation generating the lines of equal potential. Thus, in this context,
fractal geometry has led to a new problem and a new area of investigation.
Fractal geometry is also being used to describe many other complex phenomena
in nature. One of the most fruitful areas is in studying turbulent motion,
not only how it arises -the dynamics when displayed as a phase portrait are
fractal- but also the complex shapes of turbulent structures. Thus, wakes
and jets of water and clouds turn out to be fractal. This must be due to
the action of the equations of fluid motion-the Navier- Stokes equations.
The problem of relating shape to the dynamics producing it, however, is still
wide open. Tracing this relationship would be a major step in understanding
turbulence.
2: Multifractal measures |
||
If we take a simple geometrical fractal such as the Sierpinski
gasket, we can make some simple and useful mathematical observations. Given
a point P in a plane, the question: "Does P belong to the Sierpinski
gasket?" has a black-and-white answer, "yes" or "no". Such statements define
the gasket as being a fractal set. |
Another area where fractals provide an apt description are
in living things and in the Universe at large, although in each case, the
fractal description breaks down on the very small scale and on the very large.
Trees or arteries do not branch endlessly, and whole trees are not part of
supertrees.The opposite may be true for the distribution of galaxies in the
Universe. Counts of galaxies yield undisputed evidence that at comparatively
small scales the distribution is fractal. These small scales are known to
extend at least as far as 5 to 10 megaparsecs. There is increasingly strong
evidence that there are large voids at a size well above 100 megaparsecs.
Such voids are precisely what is expected in a fractal distribution.
How important are fractals? Like for the theory of chaos, it is too early
to say for sure, but the prospects are favourable. Many fractals have already
had an important cultural impact and have already been accepted as works
of a new form of art. Some are representational while others are totally
unreal and abstract. It must come as a surprise to both mathematicians and
artists to see this kind of cultural interaction.
To the layman, fractal art seems to be magical. But no mathematician can
fail to try to understand its structure and its meaning. Much of the underlying
equations would have been regarded as part of being pure mathematics, without
any application to the real world, had its visual nature not been seen. Most
important, as already mentioned, many of the most active uses of fractals
are in physics, where they have helped tackle some very old problems and
also some altogether new and difficult ones.
A final satisfying spin-off from fractal pictures is that their attractiveness
seems to appeal to the young and is having an influence on restoring interest
in science. Many people hope that the Mandelbrot set and other fractal pictures,
now appearing on T-shirts and posters, will help to give the young a feeling
for the beauty and eloquence of mathematics, and its profound relationship
with the real world.
| Time fractals in the mind
THE incessant background buzz of neurons, once thought to be
random like television snow, follows the mathematics of fractals. This finding
may alter the way scientists build models of memory. |
| Welcome to fractal country Earth, water and maths explain nature's repeating patterns
WHY is nature so keen on fractal designs for its rivers and
mountains? Take a look at how water carries soil from place to place and
it all becomes perfectly clear, says a geophysicist in New York. |
Author Benoit Mandelbrot is a physicist at the Thomas J. Watson Research Center of IBM, Yorktown Heights, New York, and a mathematician at Yale University. He originated Fractal geometry and has played a major role in developing it. Further Reading Fractal Geometry of Nature, B. B. Mandelbrot. W. H. Freeman, 1982. The Beauty of Fractals, H. O. Peitgen and P. H. Richter, Springer 1986. Fractals,J. Feder, Plenum, 1988. |
| Chaos | Quantum | Logic | Cosmos | Conscious | Belief | Elect. | Art | Chem. | Maths |